Term Project MBA723 (ECONOMICS OF COMPETITIVE STRATEGY)
Course Instructor: Dr. Vinay Ramani
Participants : Dnyaneshwar Pawar (220384)
Report: OPEC's Oil Production Strategies (1970s–1980s): A Stackelberg Leadership Perspective
Figure 1: Stackelberg Equilibrium in the 1970s Oil Market
This diagram shows the Stackelberg equilibrium in the 1970s global oil market. Key components include:
Market Demand Curve (D): Slopes downward; oil demand was relatively inelastic
OPEC's Marginal Cost (MCOPEC): Lower than non-OPEC producers due to better geological conditions
Non-OPEC Reaction Function (RFNon-OPEC): Shows how non-OPEC producers adjusted output based on OPEC's decisions
OPEC's Residual Demand (DR): Total market demand minus non-OPEC supply at each price
OPEC's Marginal Revenue (MRR): Comes from its residual demand curve
Stackelberg Equilibrium (S): Where OPEC's marginal revenue equals its marginal cost, determining optimal output
Market Equilibrium Price (P*): Much higher than competitive prices, highlighting OPEC's market influence
This equilibrium was evident during the 1973-74 oil embargo when OPEC limited production, forcing non-OPEC producers to respond, leading to a fourfold increase in oil prices.
Comparison of OPEC's Actual Production Decisions with Theoretical Stackelberg Optimal Strategies
OPEC's real production decisions in the 1970s-1980s show both similarities and differences from the Stackelberg model:
Alignment with Stackelberg Theory (1973-1979)
Strategic Output Restriction: During the 1973 embargo, OPEC showed Stackelberg-optimal behavior by cutting production, forcing non-OPEC producers to follow
Price Target Setting: In the mid-1970s, OPEC effectively implemented the Stackelberg solution by setting price targets, leaving non-OPEC producers to accept the remaining market share
Saudi Arabia as "Swing Producer"
Within OPEC, Saudi Arabia led by adjusting its oil production to maintain the cartel's cohesion.
Problems with OPEC's Leadership Strategy (1980-1986)
Misjudging Consumer Behavior: OPEC assumed people would keep buying oil regardless of price, but high prices led to less consumption and a shift to alternative energy.
Underestimating Other Producers: OPEC failed to predict non-OPEC countries' response to high prices, leading to increased production in Alaska and the North Sea.
Internal Fighting: Contrary to theory, OPEC members often broke production quotas, causing internal issues. Saudi Arabia's market share fell from 15.7% in 1980 to 6.2% by 1985. The 1986 oil price crash exposed OPEC's limits. Saudi Arabia stopped limiting production and flooded the market to punish rule-breakers inside and outside OPEC.
How Oil Reserves Weakened OPEC's Power
Strategic Petroleum Reserves (SPRs) challenged OPEC's market control:
Short-Term Protection: By 1985, the U.S. had 493 million barrels stored, protecting against supply cuts and limiting OPEC's profit from reduced production.
Changed Market Dynamics: Reserves altered non-OPEC responses to price changes, forcing OPEC to rethink strategies.
Credible Threat: Large reserves implied consumer countries could release oil if prices rose too high, limiting OPEC's options.
Psychological Effect: Beyond oil stored, SPRs weakened OPEC's market control image, damaging the psychological advantage gained during the 1973-74 embargo.
The International Energy Agency's coordination of SPRs among consumer nations formed a "follower coalition" that countered OPEC's first-mover advantage, not explained in the standard Stackelberg framework.
How the Cold War Influenced OPEC's Strategy
The Cold War significantly shaped OPEC's role as a Stackelberg leader:
Competition Between Superpowers: The U.S. and Soviet Union sought influence with OPEC members through economic aid, military equipment, and diplomatic support.
Oil as a Political Tool: The 1973 embargo highlighted oil's use for political purposes beyond profit—traditional Stackelberg models miss this.
Saudi Arabia's Relationship with America: As OPEC's main producer, Saudi Arabia balanced market power with its U.S. security alliance.
Soviet Energy Position: The USSR gained from higher oil prices while urging OPEC to challenge the West.
Developing World Unity: Many OPEC members saw oil control as key to developing countries' independence, sometimes prioritizing ideology over optimal cartel behavior.
These Cold War factors explain why OPEC sometimes made seemingly suboptimal economic decisions, balancing economic and political goals.
(Page 3: 1. Executive Summary)
OPEC's Oil Production Strategies: 1970s-1980s
This report examines OPEC's oil production management during the 1970s and 1980s using the Stackelberg leadership model from game theory. Here, OPEC, led by Saudi Arabia, sets production first, influencing non-OPEC producers.
In the 1970s, OPEC used its market power effectively during the 1973 oil crisis (Yom Kippur War) and the 1979 Iran revolution. By cutting production, OPEC drove up global oil prices, with Saudi Arabia adjusting output as a "swing producer."
The 1980s saw changes as high 1970s prices boosted non-OPEC production from places like the UK (North Sea), Alaska, and Mexico. Simultaneously, conservation and fuel switching reduced demand. OPEC members ignored quotas, and by 1985-86, Saudi Arabia increased output to regain market share, causing prices to crash.
The Stackelberg model illustrates how a market leader can influence outcomes, but it has limitations. It oversimplifies OPEC's politics, assumes perfect information, and views all non-OPEC producers as one. Despite this, it's useful for understanding cartels and how strategic decisions impacted oil prices during this period.
2. Introduction: The Global Oil Market Pre-1970s
2.1. Formation and Early Goals of OPEC
OPEC's Formation and Evolution
OPEC started in Baghdad, Iraq, in September 1960 with five founding members: Iran, Iraq, Kuwait, Saudi Arabia, and Venezuela. They formed OPEC to counter the "Seven Sisters," major oil companies controlling the industry in their territories. OPEC aimed to coordinate oil policies, ensure fair prices, provide reliable supplies, and secure investor returns. Initially, OPEC had limited influence against established oil companies.
The Changing Oil Landscape
In the late 1960s and early 1970s, the oil market changed significantly. Global demand surged as industrialized nations grew economically. Around 1970, US oil production peaked, as Hubbert peak theory predicted, increasing America's need to import oil, especially from the Middle East. This dependency empowered oil-producing nations, particularly OPEC, in the global market.
Oil Market Structure and Game Theory
The global oil market is an oligopoly, not perfectly competitive or a monopoly. A few major players (OPEC nations, large oil companies, and major non-OPEC producers) make strategic decisions affecting each other. To understand these interactions, game theory is essential.
The Stackelberg model shows how a leader can act first to influence followers. OPEC, with Saudi Arabia's production capacity, often acted as a Stackelberg leader, especially when its market power peaked. This report explores OPEC's strategies from the 1970s through the 1980s.
The Stackelberg Leadership Model Explained
Core Concepts: Leader, Follower, Sequential Moves
The Stackelberg Model
Heinrich Freiherr von Stackelberg created the model in 1934 to show competition when decisions aren't simultaneous. It usually involves two companies deciding production levels. The model's key feature is decision order:
Leader: Moves first, anticipating the follower's response.
Follower: Reacts to the leader to maximize its profit.
This sequence gives the leader an advantage by setting the pace for the follower.
Assumptions of the Model
The Stackelberg model assumes:
Few companies, typically two
Similar products
Profit maximization
Leader predicts follower's reaction
Follower accepts the leader's decision
Market entry barriers
Focus on production levels
Mathematical Setup (General Case)
In a two-company scenario:
The Follower's Decision
The follower selects ( Q_F ) to maximize profit, assuming ( Q_L ) is fixed.
Follower's Optimization Problem
This equation helps determine the follower's best response to the leader's quantity, known as the Follower's Reaction Function, written as QF = R(QL).
Leader's Optimization Problem
Solving this gives the leader's optimal output QL*. Then, the follower's output is QF* = R(QL*). The market price is P* = P(QL* + QF*).
As the leader moves first and considers the follower's response, it usually earns higher profits than in a simultaneous-move game, while the follower earns less.
Applying the Stackelberg Model to the Oil Market (1970s-1980s)
Identifying the Leader (OPEC) and Followers (Non-OPEC)
In the 1970s-1980s oil market:
OPEC's Leadership Role
Market Leader: OPEC, a loose cartel, sets production targets for its members, influencing global oil supply.
Market Followers: Non-OPEC producers, including the US, Canada, UK (North Sea), Norway, and Mexico, adjust their production based on OPEC's decisions, prices, profit goals, and capacity.
The Response of Non-OPEC Producers
Non-OPEC producers act independently, adjusting output based on price signals.
When OPEC sets its production (QOPEC), non-OPEC producers decide their supply (QNOPEC) to maximize profits. The world oil price (P) influences non-OPEC production via their supply curve SNOPEC(P).
With global demand as D(P), OPEC considers demand left after non-OPEC production. Total market quantity is OPEC plus non-OPEC production (Q = QOPEC + QNOPEC).
How OPEC Maximizes Profits
As the leader, OPEC deals with residual demand, unmet by non-OPEC producers.
OPEC knows that market price adjusts until total supply meets demand, with non-OPEC production responding to this price.
OPEC maximizes profit by choosing the right production level (QOPEC):
Market price (P) is influenced by both OPEC's production and non-OPEC response.
OPEC maximizes profit along its residual demand curve, considering other producers' reactions. By limiting output, OPEC can push prices higher than in a competitive market.
4.4. Saudi Arabia as the "Swing Producer"
Saudi Arabia, with its vast reserves and extra capacity, is the "swing producer," especially prominent in the late 1970s and early 1980s.
Changing production levels quickly to stabilize prices, meet demand, or offset other OPEC members' imbalances
Keeping members in line by threatening to flood the market if they exceeded limits
Signaling price trends through major production changes
This swing producer role shows Saudi Arabia as a Stackelberg leader, making key decisions that influenced other producers, often benefiting OPEC.
5. OPEC Strategy in Action: The 1970s
The 1970s was when OPEC had its greatest influence, leading the market and impacting the global economy.
5.1. The 1973 Oil Crisis: Embargo and Price Shock
In October 1973, during the Yom Kippur War, Arab OPEC members (OAPEC) placed an oil embargo on countries supporting Israel, mainly the US and Netherlands, while OPEC raised prices and reduced production.
5.1. The First Oil Shock (1973)
Actions: OPEC reduced production. Arabian Light crude oil prices increased from about $3 to nearly $12 per barrel by early 1974.
Impact: These cuts and price hikes caused energy shortages, rationing (like U.S. gasoline), and high inflation, triggering a global economic downturn.
5.2. Understanding the 1973 Crisis Through the Stackelberg Model
The 1973 oil crisis shows a leader-follower relationship:
OPEC as the Leader: OPEC (starting with OAPEC) limited oil output to gain political and economic power.
Non-OPEC as the Follower: Non-OPEC producers couldn't quickly fill the supply gap. They maximized production under higher prices but initially followed OPEC's market leadership.
Result: OPEC pushed market prices higher by leveraging its leadership and the slow adjustment of consumers and non-OPEC producers.
5.3. The Second Oil Shock (1979): Iranian Revolution
Background: The Iranian Revolution (1978-1979) disrupted Iran's oil production, cutting several million barrels per day from global supply, creating fear and uncertainty.
How OPEC Responded: Though the initial disruption was unplanned, OPEC, especially Saudi Arabia, chose not to fully replace the missing oil, instead raising prices aggressively in 1979 and 1980. Spot market prices soared, doubling to over $30 per barrel.
OPEC's Strategic Positioning in the 1970s
Strategic Response to External Events: OPEC exploited external events to hike oil prices by reducing output, partly due to Iran and partly by choice, maximizing revenue in a tight market. Non-OPEC producers benefited but couldn't stop price hikes.
5.4. How OPEC Gained Market Control
In the 1970s, OPEC took control of their oil industries from the Seven Sisters, becoming the main player in the global market. The Stackelberg model, depicting OPEC as the market's price-setter, described this era well.
6. Problems and Changes in the 1980s
OPEC's 1970s success led to problems in the 1980s, prompting major changes in the oil market and OPEC's operations.
6.1. How the Market Responded
OPEC's high prices triggered two key reactions:
More Non-OPEC Oil Production: Non-OPEC oil exploration became profitable, leading to new production in the North Sea, Alaska, Mexico, and beyond, steadily increasing non-OPEC output.
Reduced Demand: Consumers and industries began saving energy (using efficient cars, better insulation) and switching to other fuels (coal, natural gas, nuclear) when possible, decreasing demand for OPEC oil. Global oil demand dropped in the early 1980s due to these changes.
1. Defining the Market Setup
Players:
Leader: OPEC (denoted by subscript O)
Follower: Non-OPEC producers (denoted by subscript N)
Decision Variables:
QO: Quantity of oil produced by OPEC.
QN: Quantity of oil produced by Non-OPEC.
Total Quantity: Q=QO+QN
Inverse Demand Function: We assume a linear inverse demand curve for simplicity:P=a−bQ=a−b(QO+QN)where P is the price of oil, a is the maximum price (demand intercept), and b is the slope of the demand curve (a>0,b>0).
Cost Functions: We assume constant marginal costs for both players:
OPEC's total cost: CO(QO)=cOQO. Marginal cost is MCO=cO.
Non-OPEC's total cost: CN(QN)=cNQN. Marginal cost is MCN=cN.
Profit Functions:
2. Solving the Model using Backward Induction
The core idea of Stackelberg is that the leader (OPEC) anticipates the follower's (Non-OPEC's) reaction. So, we first determine the follower's optimal response for any given action by the leader.
Step 2a: The Follower's (Non-OPEC) Problem
Non-OPEC observes the quantity QO chosen by OPEC and then chooses its own quantity QN to maximize its own profit (πN), treating QO as fixed.
To find the maximum, we take the partial derivative of πN with respect to QN and set it to zero:∂QN∂πN=(a−bQO−bQN)+QN(−b)−cN=0a−bQO−2bQN−cN=0
Now, solve for QN:2bQN=a−cN−bQOQN∗(QO)=2ba−cN−21QO
This equation is the Non-OPEC Reaction Function. It tells us the profit-maximizing quantity QN that Non-OPEC will produce for any given quantity QO produced by OPEC. Note that if OPEC produces more (higher QO), Non-OPEC produces less (lower QN).
Step 2b: The Leader's (OPEC) Problem
OPEC knows Non-OPEC's reaction function. It anticipates that for any QO it chooses, Non-OPEC will respond with QN∗(QO). OPEC incorporates this knowledge into its own profit maximization problem.
Substitute Non-OPEC's reaction function QN∗(QO) into OPEC's profit function:πO=(a−b(QO+[2ba−cN−21QO]))QO−cOQO
Simplify the term in the parentheses (which represents the price P based on OPEC's choice and Non-OPEC's reaction):P=a−b(QO+2ba−cN−21QO)P=a−b(21QO+2ba−cN)P=a−2bQO−2a−cNP=22a−(a−cN)−2bQOP=2a+cN−2bQOThis expression shows the price OPEC can expect to receive for its oil, given its own output QO and anticipating Non-OPEC's reaction. It's OPEC's perceived residual demand curve.
Now substitute this price back into OPEC's profit function:πO=(2a+cN−2bQO)QO−cOQOπO=2a+cNQO−2bQO2−cOQO
To maximize πO, take the derivative with respect to QO and set it to zero:dQOdπO=2a+cN−bQO−cO=0
Solve for OPEC's optimal quantity, QO∗:bQO=2a+cN−2cOQO∗=2ba+cN−2cO
This is the Stackelberg equilibrium quantity for the leader (OPEC).
3. Finding the Full Equilibrium
Now that we have the leader's optimal quantity QO∗, we can find the follower's quantity and the market price:
4. Interpretation in the OPEC Context
OPEC (QO∗) sets its production level considering its own costs (cO) and Non-OPEC's costs (cN), anticipating Non-OPEC's reaction. Lower OPEC costs or higher Non-OPEC costs tend to increase OPEC's optimal output.
Non-OPEC (QN∗) produces based on its costs (cN), market demand (a,b), and crucially, reacts to OPEC's output. Its output is generally lower than it would be without a dominant leader like OPEC.
The final price (P∗) reflects the costs of both players and the demand conditions. Because OPEC acts strategically to restrict output (compared to a purely competitive outcome), the Stackelberg price is higher than the competitive price but typically lower than a pure monopoly price.
The model mathematically demonstrates OPEC's ability (as the leader) to influence the market price by strategically choosing its output level (QO∗), forcing Non-OPEC (QN∗) to adjust, leading to a specific market price (P∗). The 1970s actions by OPEC (cutting QO) can be seen as aiming to shift the equilibrium to a much higher P∗. The 1980s shifts (rising cO effectively due to quota needs, falling cN due to new discoveries, changes in 'a' due to conservation) altered these equations, leading to the breakdown described earlier.
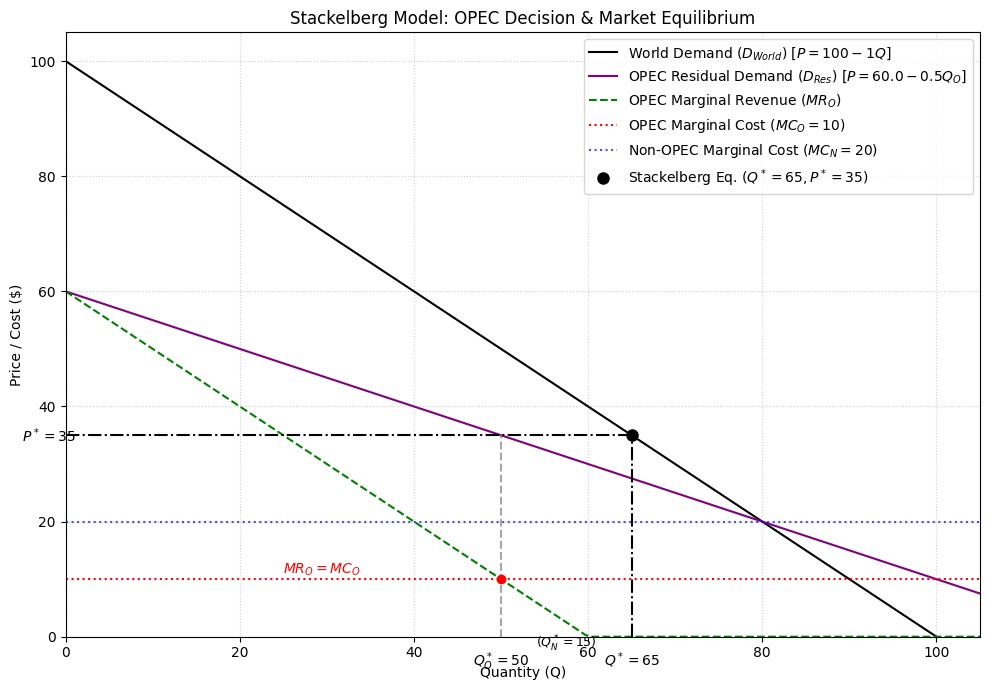
World Demand (DWorld, Black Line): Shows the total relationship between price and quantity demanded in the market.
OPEC Residual Demand (DRes, Purple Line): This is the demand curve OPEC actually faces after accounting for the supply Non-OPEC will provide at each price (implicitly via their reaction function). It starts at a lower price intercept and is steeper than the world demand because Non-OPEC satisfies some demand, especially at higher prices.
OPEC Marginal Revenue (MRO, Green Dashed Line): Derived from the residual demand curve. It lies below DRes with twice the slope.
OPEC Marginal Cost (MCO, Red Dotted Line): OPEC's constant marginal cost of production (cO=10).
OPEC's Output Decision: OPEC maximizes its profit by producing where its marginal revenue equals its marginal cost (MRO=MCO). This occurs at QO∗=50.
Determining Total Output and Price:
OPEC produces QO∗=50.
Non-OPEC produces QN∗=15 (from reaction function or calculation).
The market price P∗ is determined by the total quantity Q∗ on the World Demand Curve. P∗=35.
Equilibrium Point (Black Dot): Represents the final market outcome (Q∗=65,P∗=35).
These graphs visually represent the strategic interaction. OPEC leverages its first-mover advantage to choose its quantity (QO∗) based on the residual market demand, knowing Non-OPEC will react (QN∗), leading to the final market price (P∗).
6.2. Internal OPEC Problems: Quota Compliance Issues
As OPEC's market share and revenue declined due to lower demand and falling prices, members struggled to follow their own rules.
Quota System: In 1982, OPEC attempted to maintain prices by setting production limits.
Cheating in OPEC
Many members, facing economic issues, produced more oil than allowed to earn more money. This oversupply pushed prices down, undermining the group's strategy.
6.3. Saudi Arabia Gives Up Its Balancing Role (1985-1986)
Saudi Arabia, the "swing producer," cut production to stabilize prices but lost market share. Frustrated by quota cheats and shrinking influence, they changed their approach.
Market Share Strategy
In late 1985 and early 1986, Saudi Arabia shifted focus from defending prices to regaining market share, increasing production and using "netback pricing" to sell oil.
6.4. The 1986 Price Collapse: A Change in Strategy?
Saudi Arabia's increased output, combined with high non-OPEC production and weak demand, flooded the market with oil.
Price Crash
Oil prices plummeted from about $27 per barrel in late 1985 to under $10 by mid-1986.
What This Meant for the Market Model
This event marked a shift from the simple leader-follower approach focused solely on price maximization.
The model broke down: OPEC, led by Saudi Arabia, stopped trying to keep prices high.
Saudi Arabia shifted from seeking immediate profit to securing long-term market share or disciplining members through a price war.
This highlighted leadership limits when followers grow powerful or ignore rules.
The 1980s showed the unstable leader-follower dynamic in the oil market. The leader's actions inadvertently encouraged non-OPEC production increases and OPEC quota cheating, weakening the leader's control.
OPEC's Behavior and the Stackelberg Leadership Model
7.1. Strengths of the Model
The Stackelberg model helps explain OPEC's oil market operations:
OPEC makes decisions first, influencing non-OPEC producers' output adjustments.
As the first-mover, OPEC can control market outcomes and prices by anticipating reactions.
It explains why OPEC maintains higher prices than a fully competitive market.
It aligns with Saudi Arabia's role as the main decision-maker.
It clarifies stable prices (when OPEC manages effectively) and price swings (when strategies change, like in 1973, 1979, or 1986).
7.2. Limitations and Criticisms
Despite its value, the model has drawbacks:
It treats OPEC as a unified entity, ignoring individual countries' differing goals, costs, and needs.
It oversimplifies non-OPEC producers as a single reactive group, though they vary greatly.
It assumes OPEC knows others' reactions, but OPEC faces uncertainty about non-OPEC responses and demand changes.
The basic model focuses on one decision period, missing long-term factors like exploration investment, capacity building, new technologies, and demand changes.
Too Much Focus on Quantity: The model emphasizes production amounts but overlooks factors like pricing methods and political issues that affect the oil market.
Problem with "Leader" Definition: It's unclear who the leader is. The model often treats all of OPEC as the leader, which is inaccurate when members disagree, despite Saudi Arabia's frequent role as the main decision-maker.
Despite these issues, the Stackelberg model provides a good starting point to understand the basic power dynamics in the oil market during OPEC's peak.
8. Impact and Legacy
The Stackelberg model's study of OPEC's 1970s and 1980s actions greatly influenced economic understanding and left a lasting impact.
8.1. Understanding Commodity Markets and Cartel Behavior
Analysis Framework: The model offered a formal way to study cartel and dominant company behavior in imperfectly competitive commodity markets, highlighting strategic interactions and potential market manipulation.
Explaining Price Changes: It explained extreme price changes in markets like oil when leaders switch strategies or when cartel cooperation breaks down, as in 1973, 1979, and 1986.
Resource Economics: OPEC's example is now standard in resource economics classes, illustrating how game theory applies to limited natural resources, showing the interplay of geology, economics, and politics.
8.2. Influence on Economic Theory and Policy
Game Theory Uses: Studying OPEC increased interest in game theory models (Stackelberg, Cournot, etc.) to understand industries with few sellers.
Energy Policy: The 1970s events, partly analyzed via the Stackelberg model, influenced energy policies. Nations sought to reduce OPEC dependence, save energy, develop alternatives, and build oil reserves in response to OPEC's market power.
Antitrust and Regulation
While international cartels like OPEC operate outside national antitrust laws, studying them provides insights into anti-competitive behaviors in other concentrated industries.
Looking at OPEC through the Stackelberg model shows how strategic leadership can change prices and supplies in a complex market. Despite changes like shale oil dynamics and varying OPEC unity, dominant producers still influence the market while others respond. The 1970s-1980s period and its models remain key to understanding global resource markets.
Conclusion
The 1970s to 1980s reshaped the global oil market due to OPEC's strategic actions. The Stackelberg model offers a simple framework to understand OPEC's strategy, viewing OPEC (mainly Saudi Arabia) as the leader setting output, with non-OPEC producers reacting. The major price hikes of 1973 and 1979 illustrate this leader-follower dynamic, with the leader limiting supply for higher prices. Saudi Arabia's role as "swing producer" reinforced OPEC's market influence.
However, the 1980s exposed the limits of this leadership. High prices led to increased non-OPEC supply and decreased demand, weakening OPEC's control. Internal discipline eroded as members prioritized individual revenue over collective goals. Saudi Arabia eventually abandoned its swing producer role, leading to the 1986 price collapse. This highlighted the instability of Stackelberg leadership and the need for strategic shifts beyond price maximization.
While the Stackelberg model simplifies OPEC's internal politics and non-OPEC responses, it provides valuable insights. It shows the advantage of making the first move and anticipating competitors' reactions, helping us understand cartel behavior and market power. Examining OPEC's 1970s and 1980s actions through this lens reveals how a few key players can influence the global economy.
References
Adelman, M. A. (1995). The Genie out of the Bottle: World Oil Since 1970. MIT Press.
Griffin, J. M. (1985). OPEC Behavior: A Test of Alternative Hypotheses. The American Economic Review, 75(5), 954-963.
Hamilton, J. D. (2009). Causes and Consequences of the Oil Shock of 2007-08. Brookings Papers on Economic Activity, Spring, 215-261.
Hnyilicza, E., & Pindyck, R. S. (1976). Pricing policies for exhaustible resources. Journal of Economic Theory, 12(2), 139-154.
Salant, S. W. (1976). Exhaustible Resources and Industrial Structure: A Nash-Cournot Approach to the World Oil Market. Journal of Political Economy, 84(5), 1079-1093.
Smith, J. L. (2009). World Oil: Market or Mayhem? Journal of Economic Perspectives, 23(3), 145-164.
Stackelberg, H. von. (1934). Marktform und Gleichgewicht. Springer.
Yergin, D. (1991). The Prize: The Epic Quest for Oil, Money, and Power. Simon & Schuster.
Published using